The analytics and AI layer of Genialcloud 11: dashboards, KPIs and predictive models from different sources, with no manual extraction. And with Powua IoT it monitors and collects data directly from your machinery, to analyze them alongside the rest of your business data.

Interactive dashboards, dynamic reports, live KPIs and predictive models from management, document and field sources, with no manual extraction.
Interactive dashboards, dynamic reports and KPIs on operational data, always up to date and with no data warehouse.
Ask Trinity AI and get dashboards and answers built to order, with no technical skills.
Industrial edge, real-time OEE and data from sensors, PLCs and machinery straight from the floor.
Detects pre-failure signatures on machinery and anticipates downtime with a suggested maintenance window.
Management, document and field data integrated into one layer, with no copies or extractions.
Answers on your data, builds predictive models and flags anomalies before they escalate.
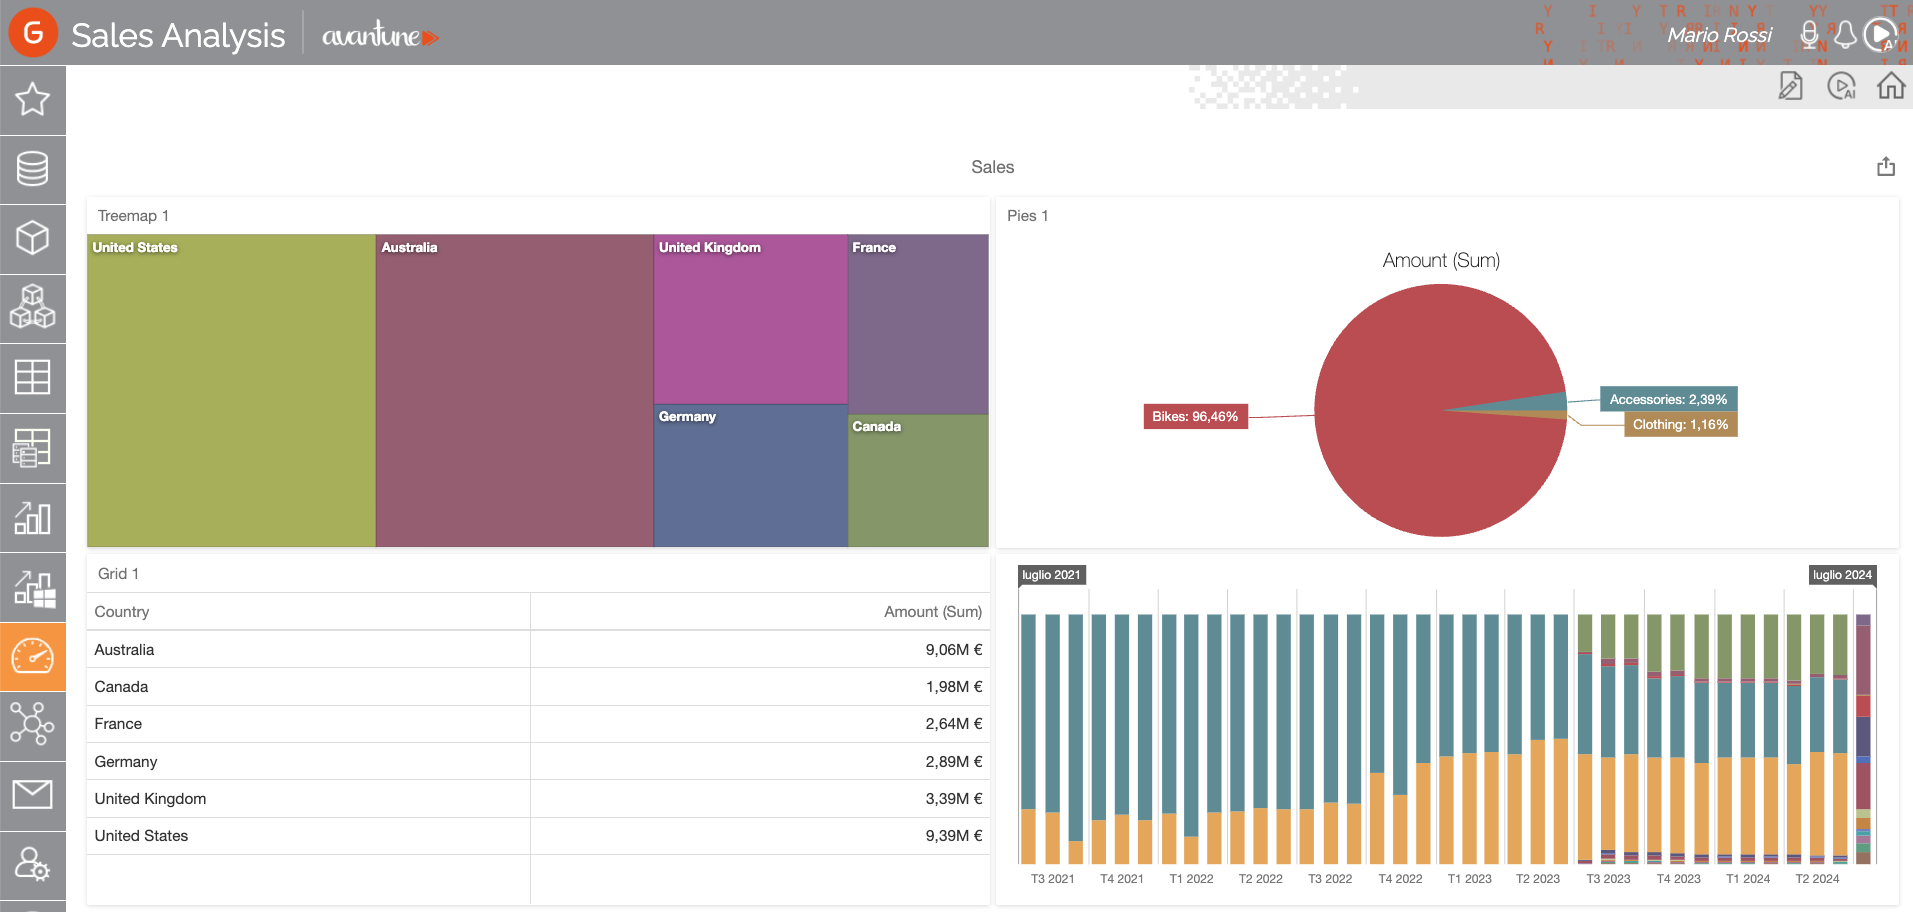
Managers and team leads build analytical views, reports and KPIs on their own, describing what they need in plain words. Powua analyzes performance, trends and scenarios on operational data in real time, with no data warehouse and no waiting on IT.

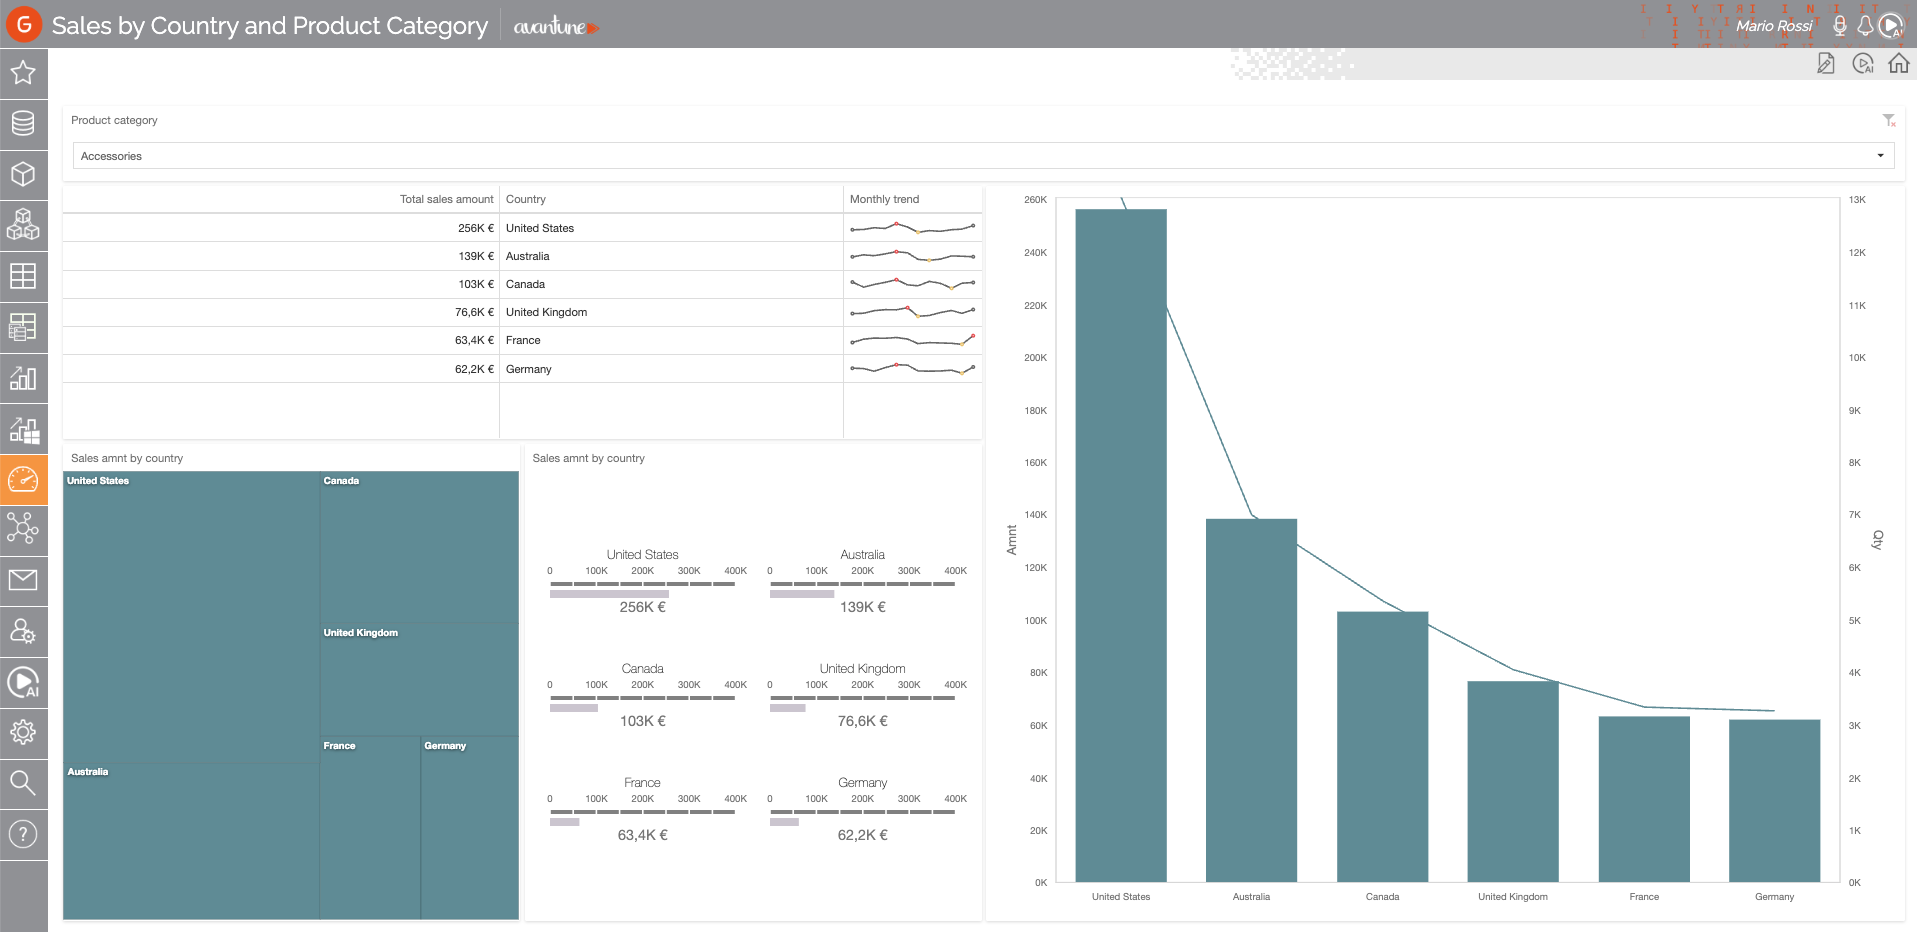
Trinity AI answers complex questions on your data in plain language, builds dashboards on request with no technical skills and flags anomalies before they escalate. Data stops being an IT product and becomes an operational tool. Like a colleague who knows every number in the company.
Tell us about your processes and we'll show you Powua on a scenario close to yours: analytics, IoT or predictive maintenance. No pre-packaged pitch.
A demo on your data. We'll show you Powua on a scenario close to yours: analytics, IoT or predictive maintenance.
New prospects. We run proof of concepts on your real data: one plant, one line or a KPI set.
For partners. System integrators and channel partners can select the "Partner / System Integrator" role: our dedicated team will be in touch.